The next step is to schedule a discovery session so we can understand your risk management needs in more detail.


Company
Saint John, NB, a Canadian municipality on the Bay of Fundy, has a population of 126,000. They process hundreds of claims and incidents annually, a number that was increasing year-over-year.
Challenges
Manual data entry for every new claim and incident, notes and files in several locations in inconsistent formats with no search capability, limited and onerous reporting hindered forecasting and trend analysis.
Solution
ClearRisk's Centralized Database with Online Data Submission Web Portal and Automated Reporting Capabilities.

Challenges
ClearRisk spoke with Ian Fogan, Deputy Commissioner and Risk Manager of the City of Saint John, to learn how ClearRisk has changed the work of his team.
Prior to the introduction of the system, the team tracked all data in Excel spreadsheets and paper file folders. Reporting was time-consuming and difficult as data had to be manually pulled from various sources. This meant that claim and risk management was reactive, as data could not be analyzed in real time.
Solution
The Risk and Insurance Department has been able to change how they receive and interact with data. The online web portal, with drop-down menus and mandatory fields, can be accessed from any Internet-enabled device. This system streamlines the claims reporting process and eliminates almost all manual data entry.
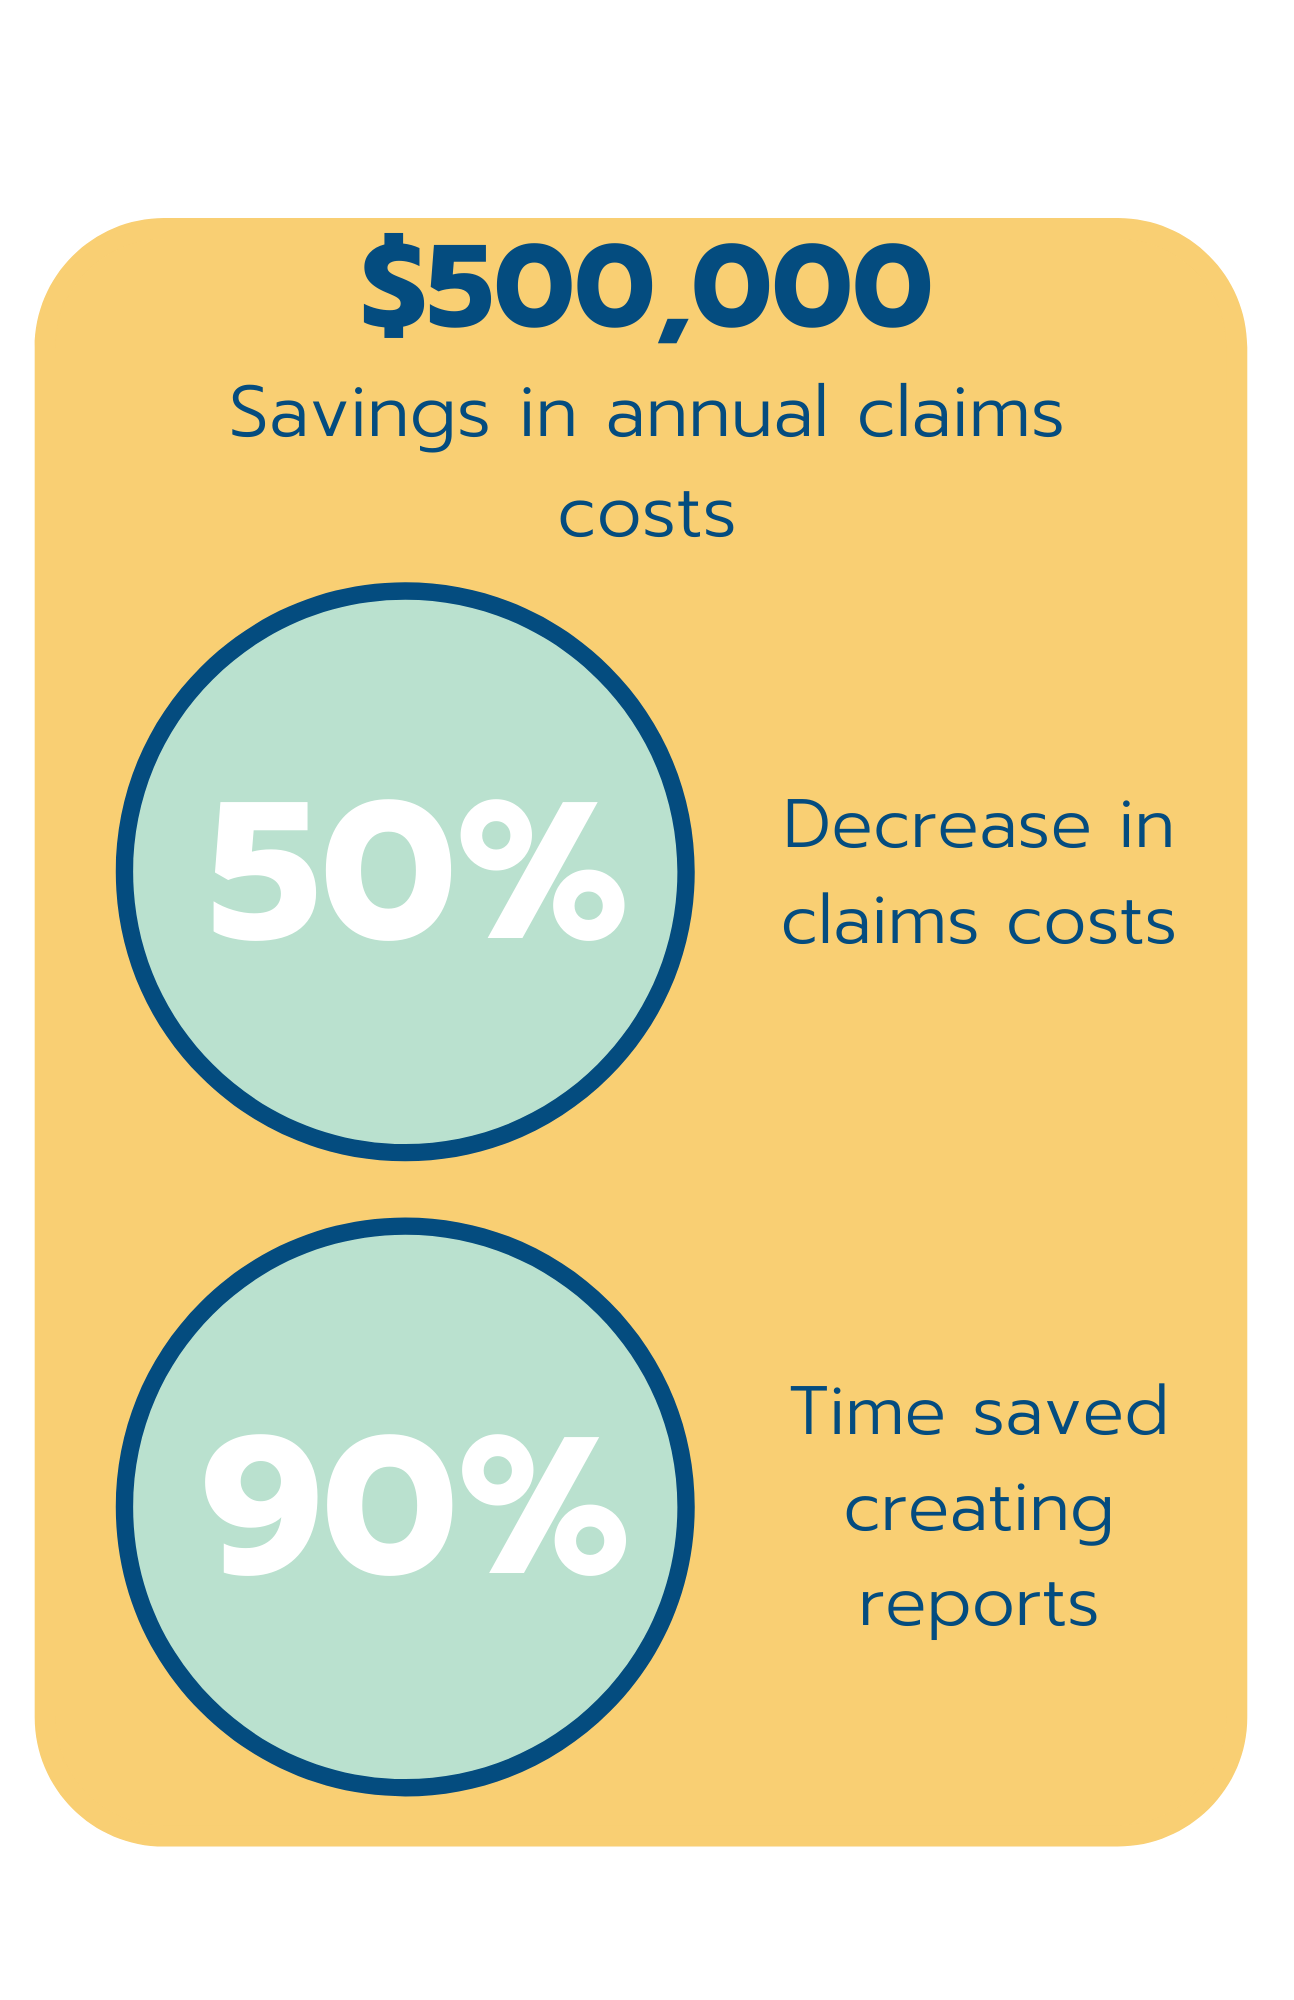
ClearRisk's centralized database has allowed the team to allocate costs across departments, uncovering losses and holding managers accountable. Each department is now responsible for an individual budget. The results are $500,000 in annual savings.
During the implementation of ClearRisk's system, there was a full migration of all historical data which allowed the city to run trend analysis and loss reports. The team is now able to report on both historical and current data, which allows them to better predict future occurrences and implement measures to reduce losses.
Pulling or creating reports is reliable, effortless, and can be completed in seconds, meaning Ian uses them much more often. Graphs, dashboards, and other customizable options make understanding and sharing useful data simple.
Results
- 50% reduction in claims costs
- Reduced frequency of claims
- Elimination of manual data entry
- Increased data integrity
- Awareness and buy-in of proactive risk management initiatives
- An average 90% reduction in time spent reporting and higher level of reports

Request a demo
.png)
ClearRisk 2020. This case study constitutes proprietary information of ClearRisk. No part of this case study may be reproduced, transmitted, transcribed stored in a retrieval system or translated into any language in any form without the written permission of ClearRisk. ClearRisk reserves the right to make changes in this case study at any time and without notice. ClearRisk makes no warranties, expressed or implied in this case study. The topics discussed in this case study are broad in scope and situations can differ greatly in legal jurisdictions, different industries, and different companies.
.png?width=1050&height=450&name=email%20signature%20(4).png)

