.png?width=1050&height=450&name=email%20signature%20(4).png "email signature (4)")

Risk management departments have become commonplace and necessary for large public or private organizations that have broad and diverse operations. Risk management teams are responsible for keeping track of a huge amount of data, including details related to incidents, claims, insurance policies, physical assets, certificates, contracts, employees and more. Effective risk management relies on reports produced from this data to enhance visibility, inform decision making, and optimize risk organization-wide.
When creating reports to present to decision makers, highlighting the right information is critical. Each report serves a different purpose depending on what data fields are included. It’s important to consider more than one report because each one tells a different story about what’s happening in the organization. Here are 10 reports that every risk management team should monitor to promote risk visibility, enhance decision making, and achieve process efficiencies.
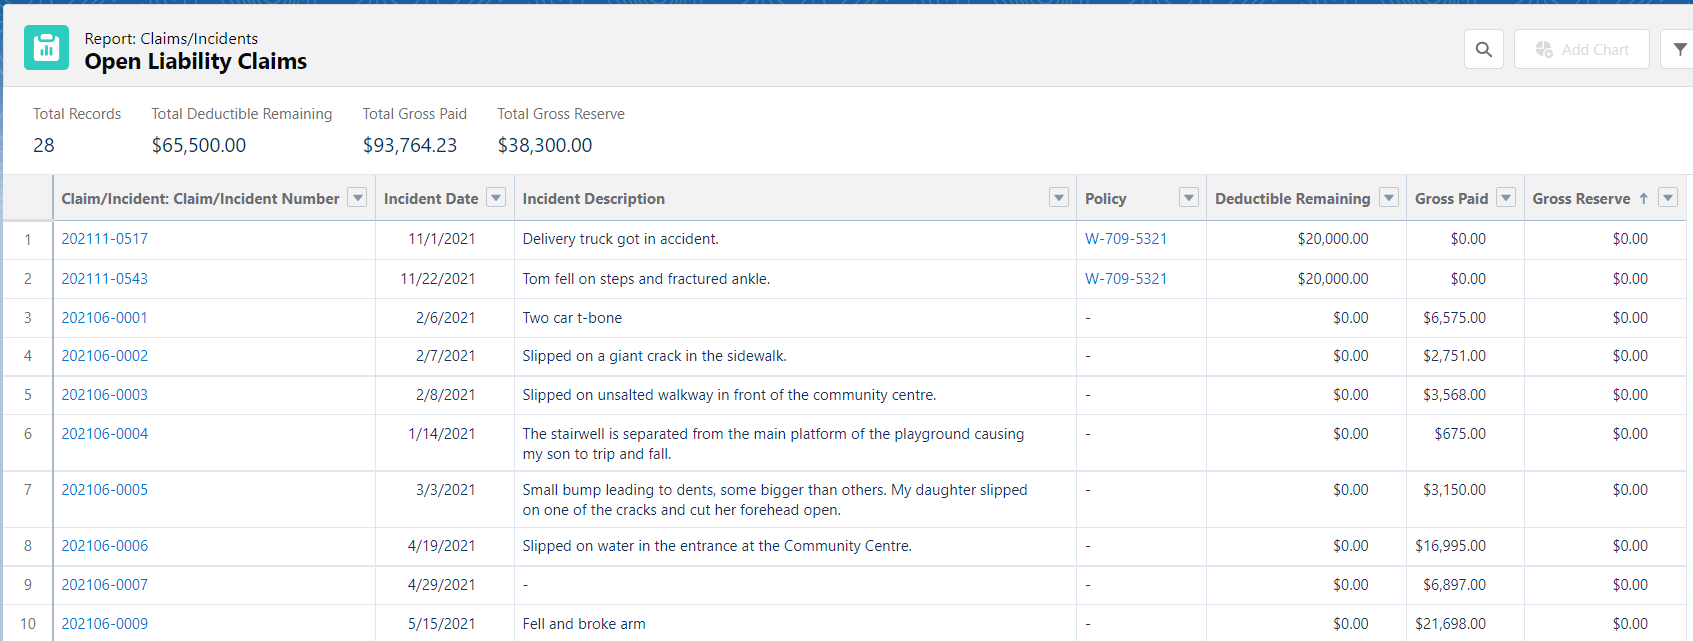
1. Open Liability Claims
This report helps your team know what liability claims are in process at any given time, allowing awareness of any financial implications that may impact the business. Liability claims happen when a third party alleges that the organization is responsible for some loss or damage. Large, reputable organizations experience these claims on a relatively frequent basis. These organizations likely also purchase liability insurance. Liability claims potentially have large payouts, making it important to monitor them on a regular basis. This report can also help determine which claims are covered under your liability insurance policies and which claims may have to be financed by the company itself.
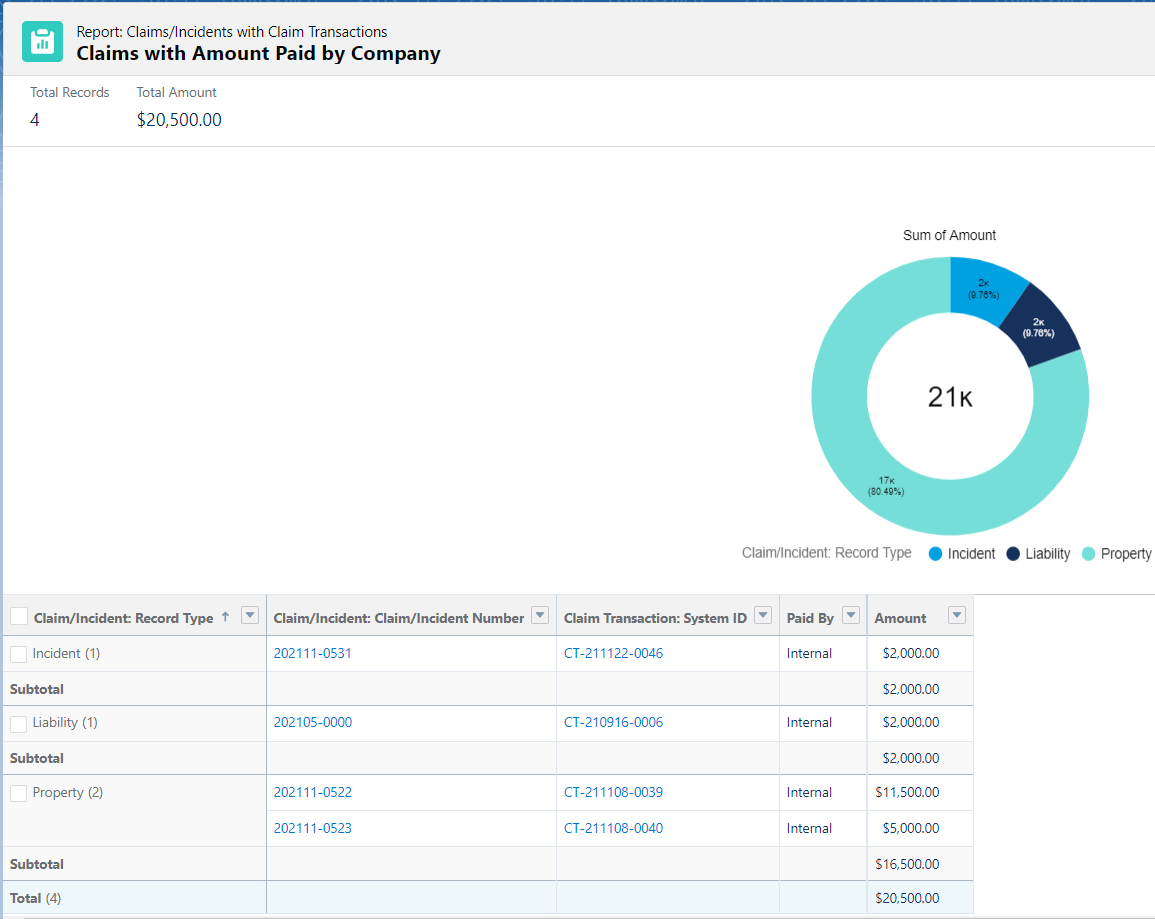
2. Claims with Amount paid by Company (self)
This report provides you with knowledge about how much you’ve paid out in claims, and predicts how much you can expect to pay out in the future. The report would be of particular interest to companies that consider themselves to be self-insured. A company self-insures when it sets aside a predetermined amount of money to remedy any unexpected claims or losses. This risk management technique is an increasingly common alternative to commercial insurance, especially in response to increased insurance premiums during a hard market. Losses that are common and predictable are easily covered under a self-insured retention (SIR). However, companies with an SIR commonly also purchase commercial insurance to protect themselves from residual risk from not being able to cover losses resulting from high risk, low frequency events. This method allows risk teams to increase their SIR/deductibles at a comfortable rate, and benefit from the increased cash flow resulting from reduction in insurance premium costs.
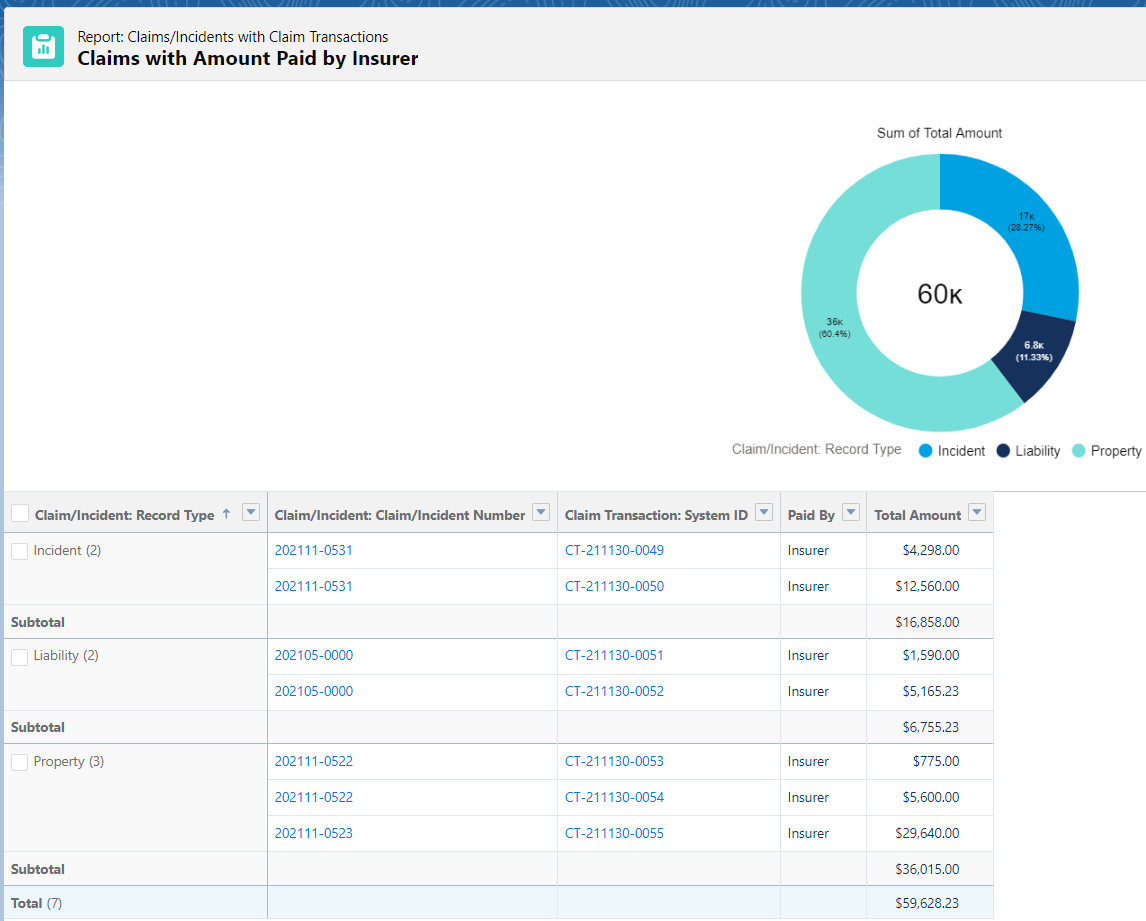
3. Claims with Amount paid by Insurer
This report highlights information relating to all claims that have been paid by your insurer. Reviewing this report on a regular basis gives the risk team visibility on which policy deductibles have been pierced. Reviewing the details and financial transactions involved in these claims allows a better understanding of your coverage towers and how your policies interact. It is important for the risk team to keep track of how close you are to exhausting the limits on your policies. It is also important to monitor line and aggregate limits as when they are exhausted, the remaining expenses are incurred out of pocket by your organization.
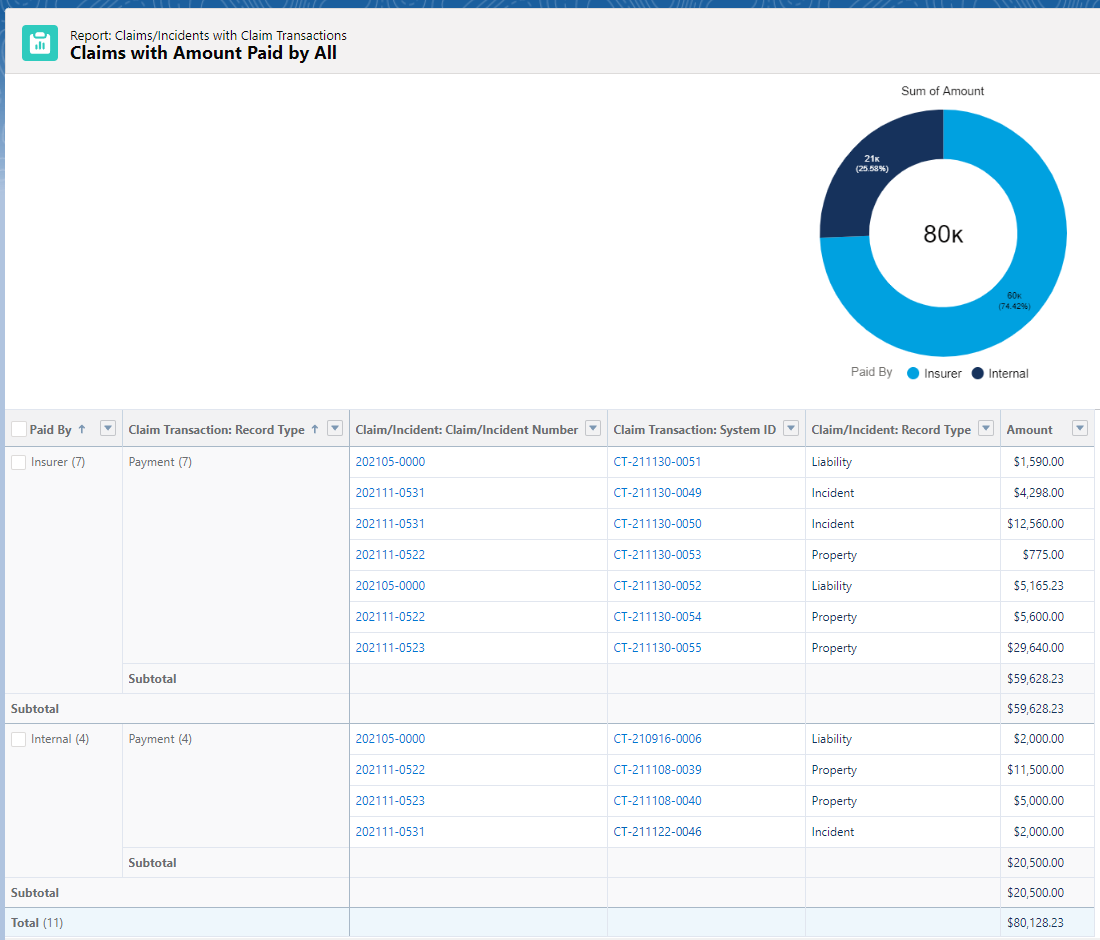
4. Claims with Amount paid by all
This report can be used as a comparative analysis of the previous two reports. The goal of this report is to be able to compare and make changes that optimize payouts wherever possible. The report lists the amount paid for each claim to monitor what you pay vs what your insurers pay. This report would also reveal trends in claims causing the largest payouts. Risk departments can use this data to advocate for capital spending initiatives that mitigate those claims. For example, if a company paid out a significant amount from automobile accidents, it may consider financing training resources for fleet drivers in order to reduce the frequency of this claim type. Trends revealed in this report inform the nature of risk management initiatives that will have a significant impact and return on investment.
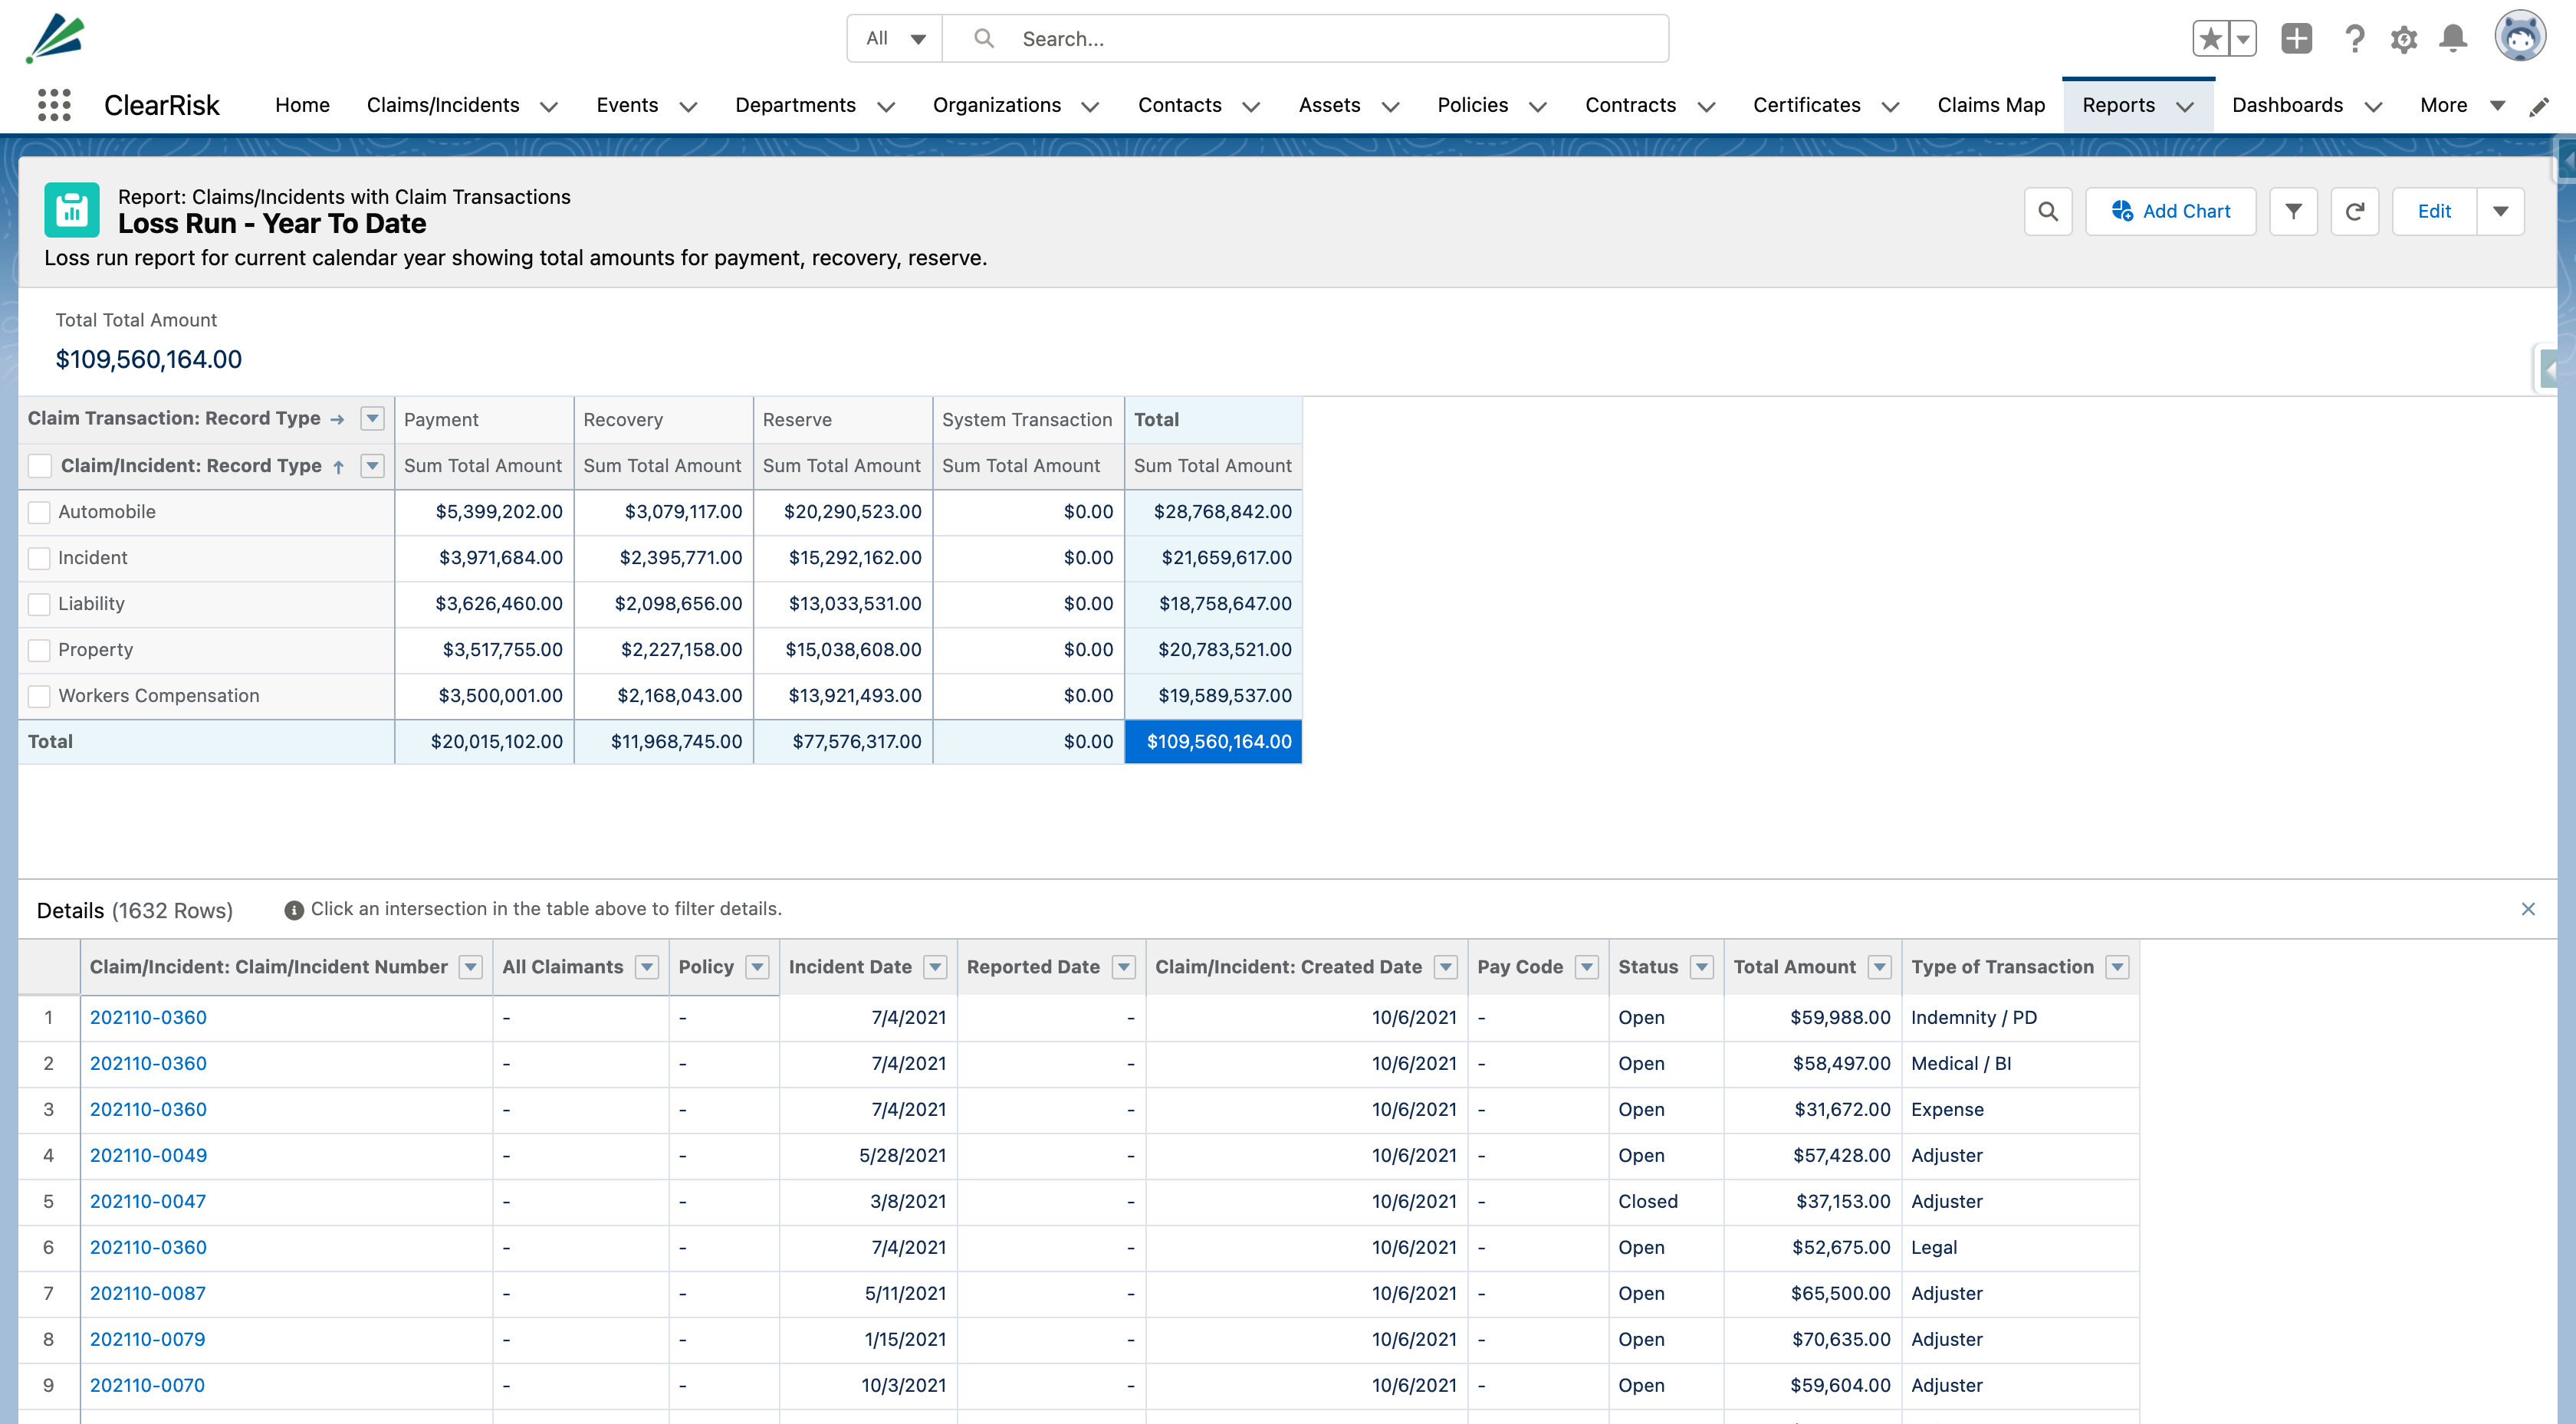
5. Loss Run Year to Date
Loss runs are detailed reports about your organization’s claims history, telling insurers the story of your risk and whether you will be a profitable client. This is a large report detailing all claims (closed, opened, reopened), showing all losses in the run of the year and every financial implication associated with each claim. The same way banks use credit scores to identify good candidates for loans, insurance companies will use loss run history to determine how risky you are to insure. It is critical to monitor your loss run to help you make decisions that improve your risk profile. Optimizing risk programs with information from your loss run will help avoid increased premiums and even loss of coverage if the insurer considers you to be too risky.
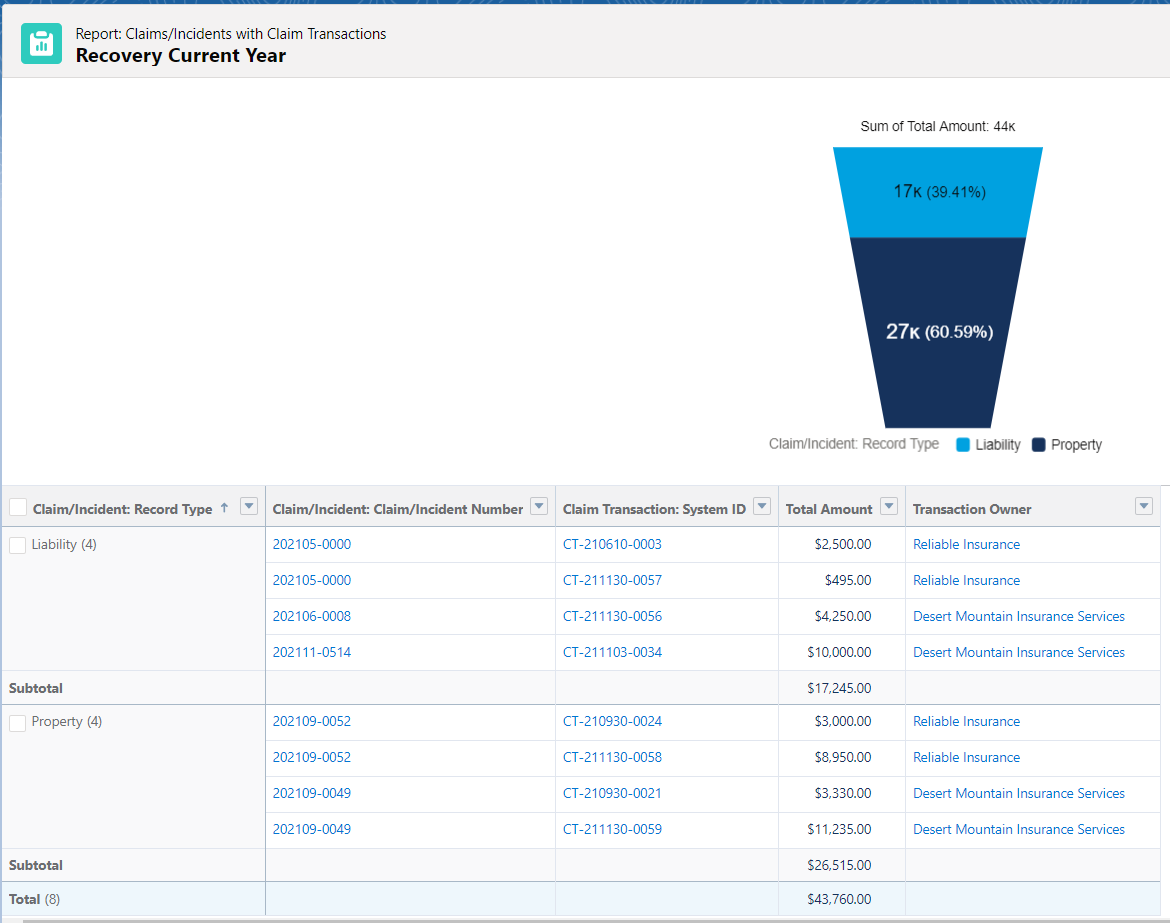
6. Recovery Current Year
This report shows all the amounts recovered from claims covered under your various insurance policies, or from the responsible third party. For closed claims, this would show the amount actually recovered for a specific claim. This data would be useful in determining what reserves should be for future claims of a similar nature. Furthermore, for open claims it would be useful to track expected recoveries that can later be compared with the actual recovered amount. This allows the risk department to assess the accuracy of their predictions and establish mechanisms to budget for anticipated variations. In sum, this report helps anticipate how much you’re likely to recover from insured losses.
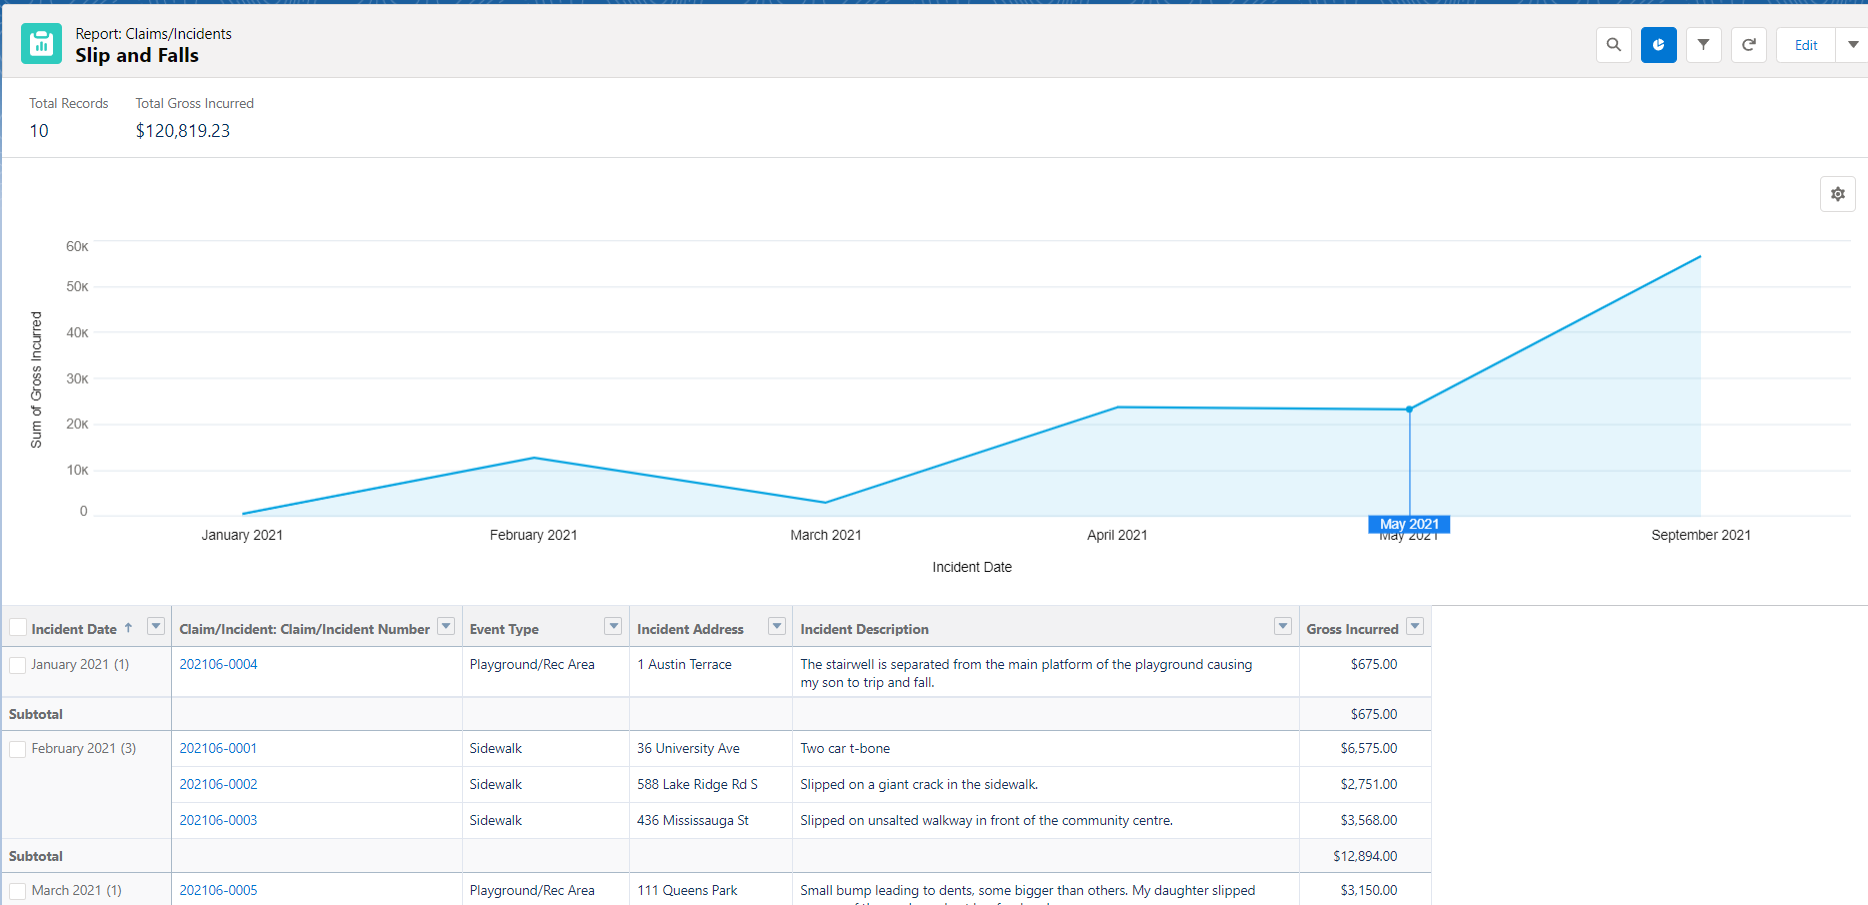
7. Slip and Falls
Slip-and-fall claims are the most frequent type of negligence claims against municipalities and property management companies that have a large number of properties and experience significant foot traffic. This report will show all claims/incidents resulting from a slip and fall. Slip-and-falls happen often and may result in high payouts. They are harder to determine the root cause at the time, and can be especially costly in cases where injuries are sustained for a long period of time. To make the most of this report, it is critical that the risk team documents near miss incidents. Near miss reporting helps the organization uncover high risk areas of the organization that are previously unknown. This helps risk teams predict where slip-and-falls are likely to happen and be proactive at mitigating them in the future.
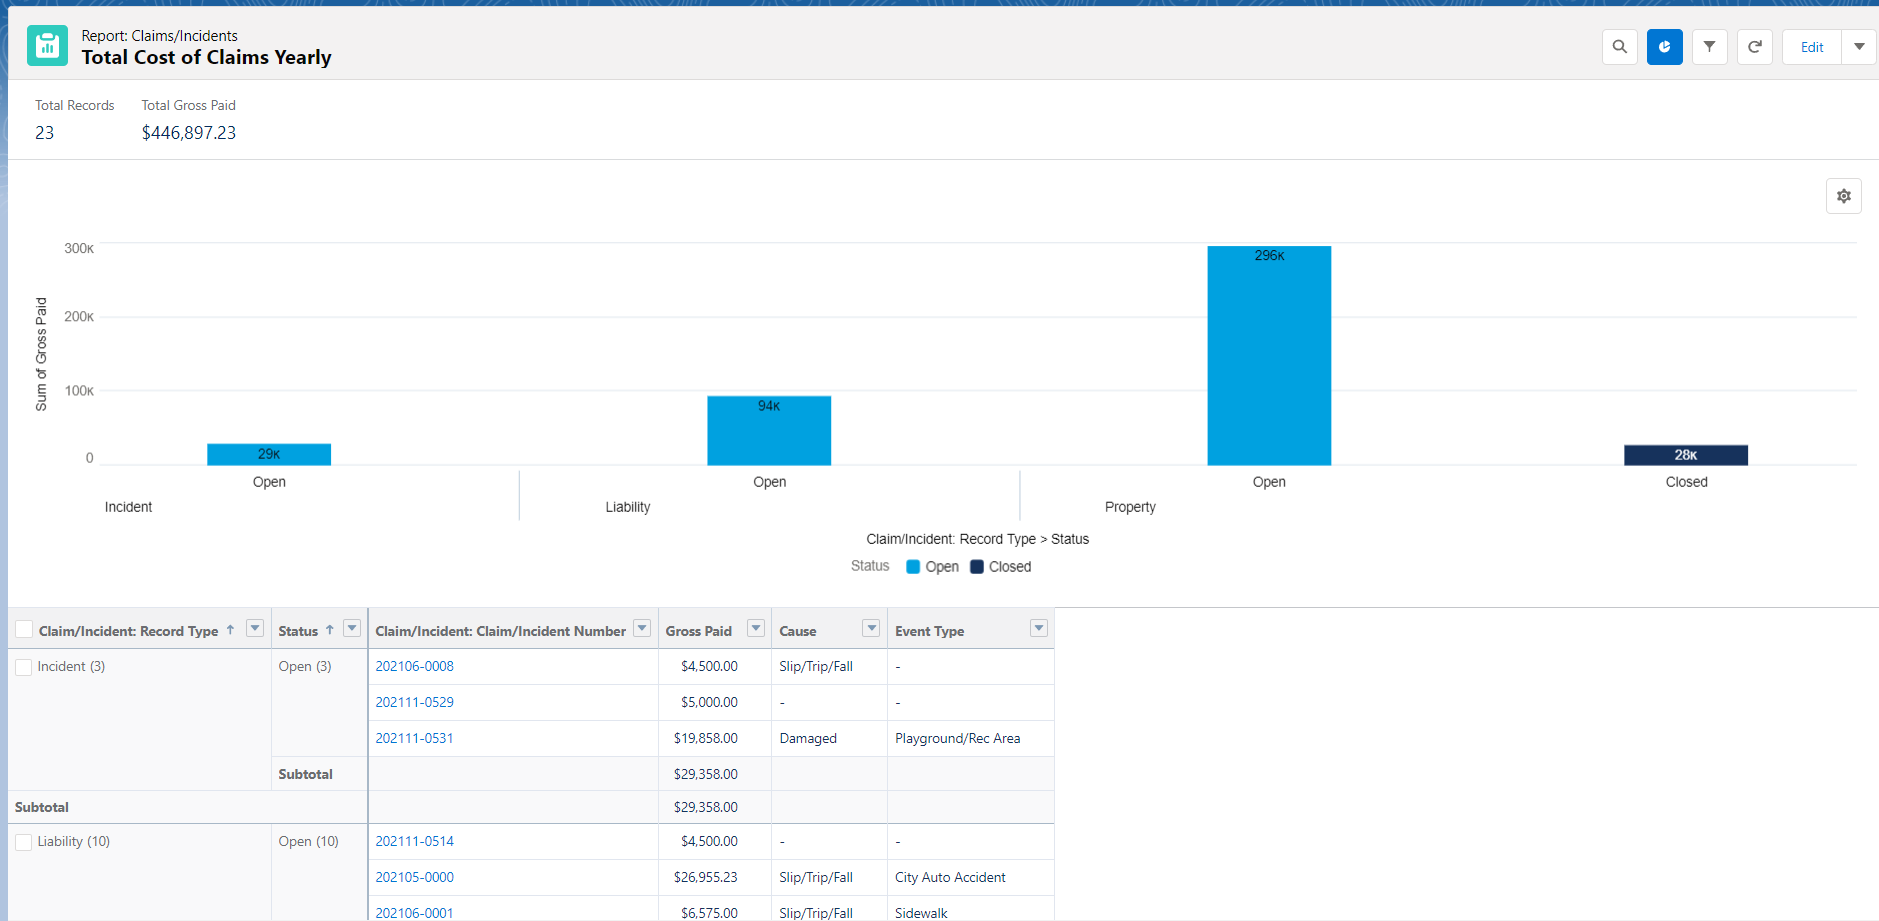
8. Total Cost of Claims Yearly
This report should be produced yearly and presented to executive decision makers for an overview on how much has actually been paid out in claims. The report should also include any claims that remain open at the end of the fiscal year, and how much is being held in reserves. Producing this report yearly allows the executive team to compare their claims costs to previous years. Findings from this report help to identify the effectiveness of any risk mitigation efforts year after year. The data may also reveal if there are any new exposures that are negatively impacting the total cost of claims. Finally, finance executives should consider findings from this report when allocating claims budgets for the upcoming fiscal year.
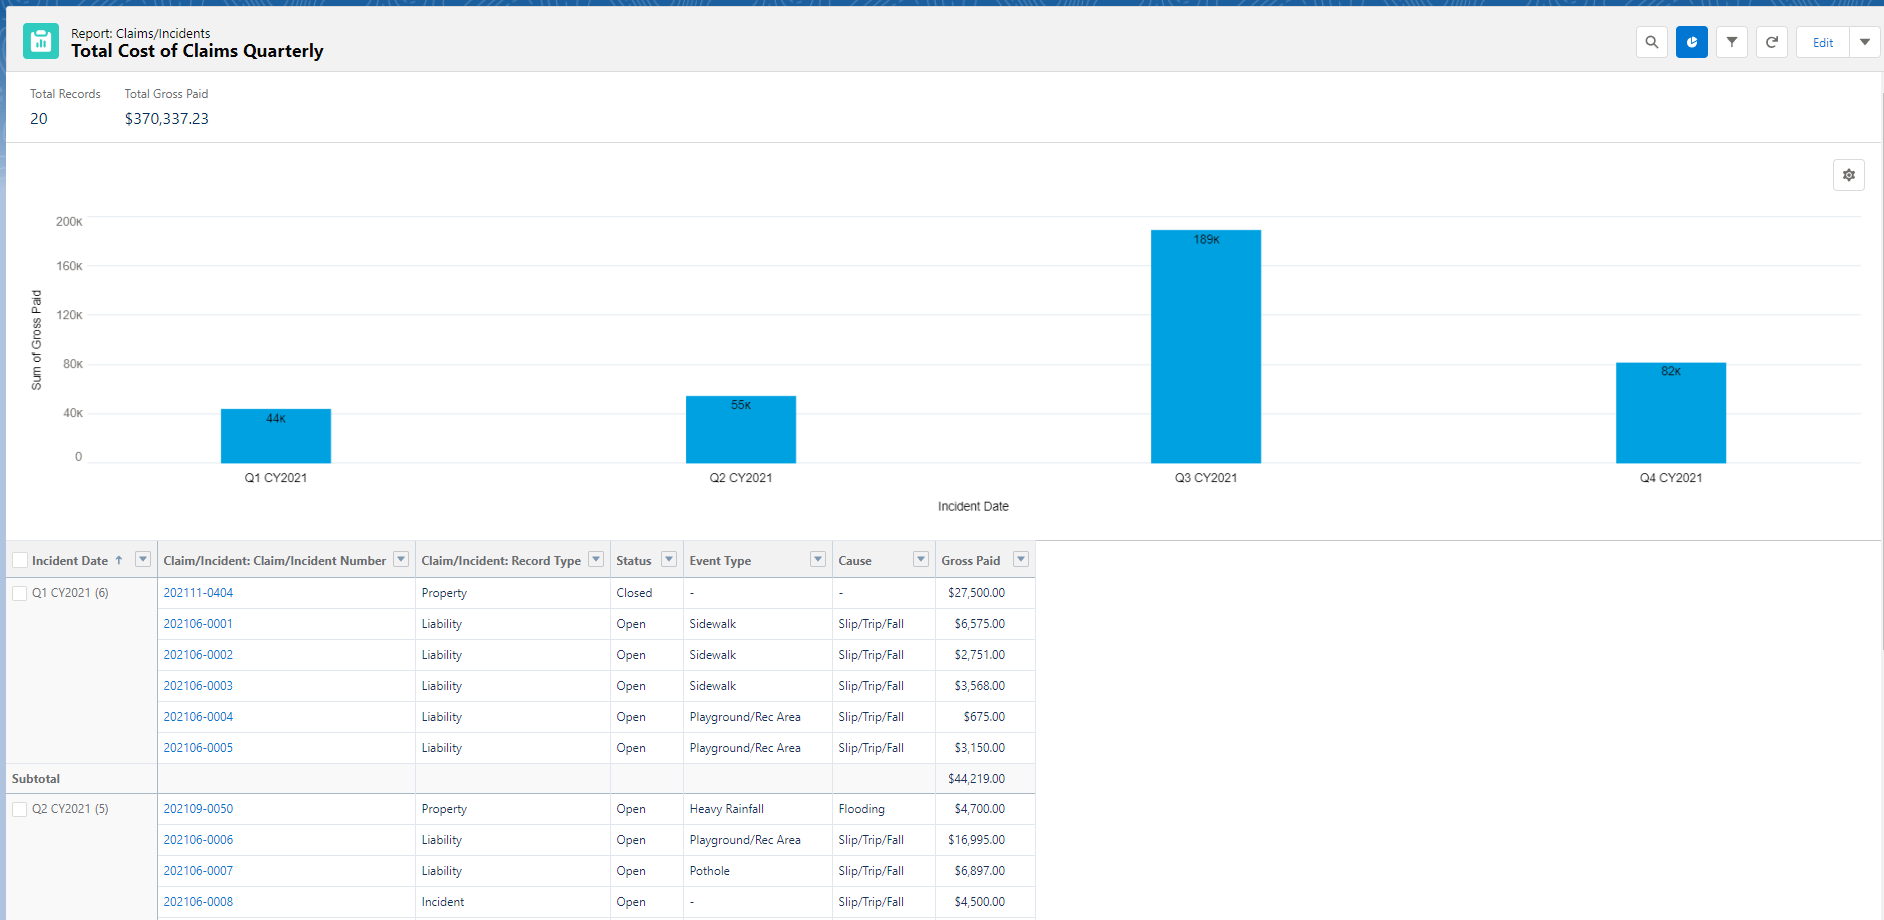
9. Total Cost of Claims Quarterly
While the yearly report offers a good high level overview, it is also important to evaluate your performance quarter to quarter. A quarterly report lets you know how much you’re paying out in claims quarter to quarter. The goal is to notice any spikes or changes in patterns that are out of the ordinary. For example, a company may expect to pay out the most claims in winter compared to other seasons; quarterly reports would illustrate the accuracy of this expectation. If the report shows an unusual spike in claims during the spring, it would be worth it for the risk team to investigate further as to why this happened. For this report it may be helpful as well to consider claim types. For example, if slips and falls resulted in unusually high losses in winter, this may be an indicator that the company needs to invest in better snow and ice clearing.
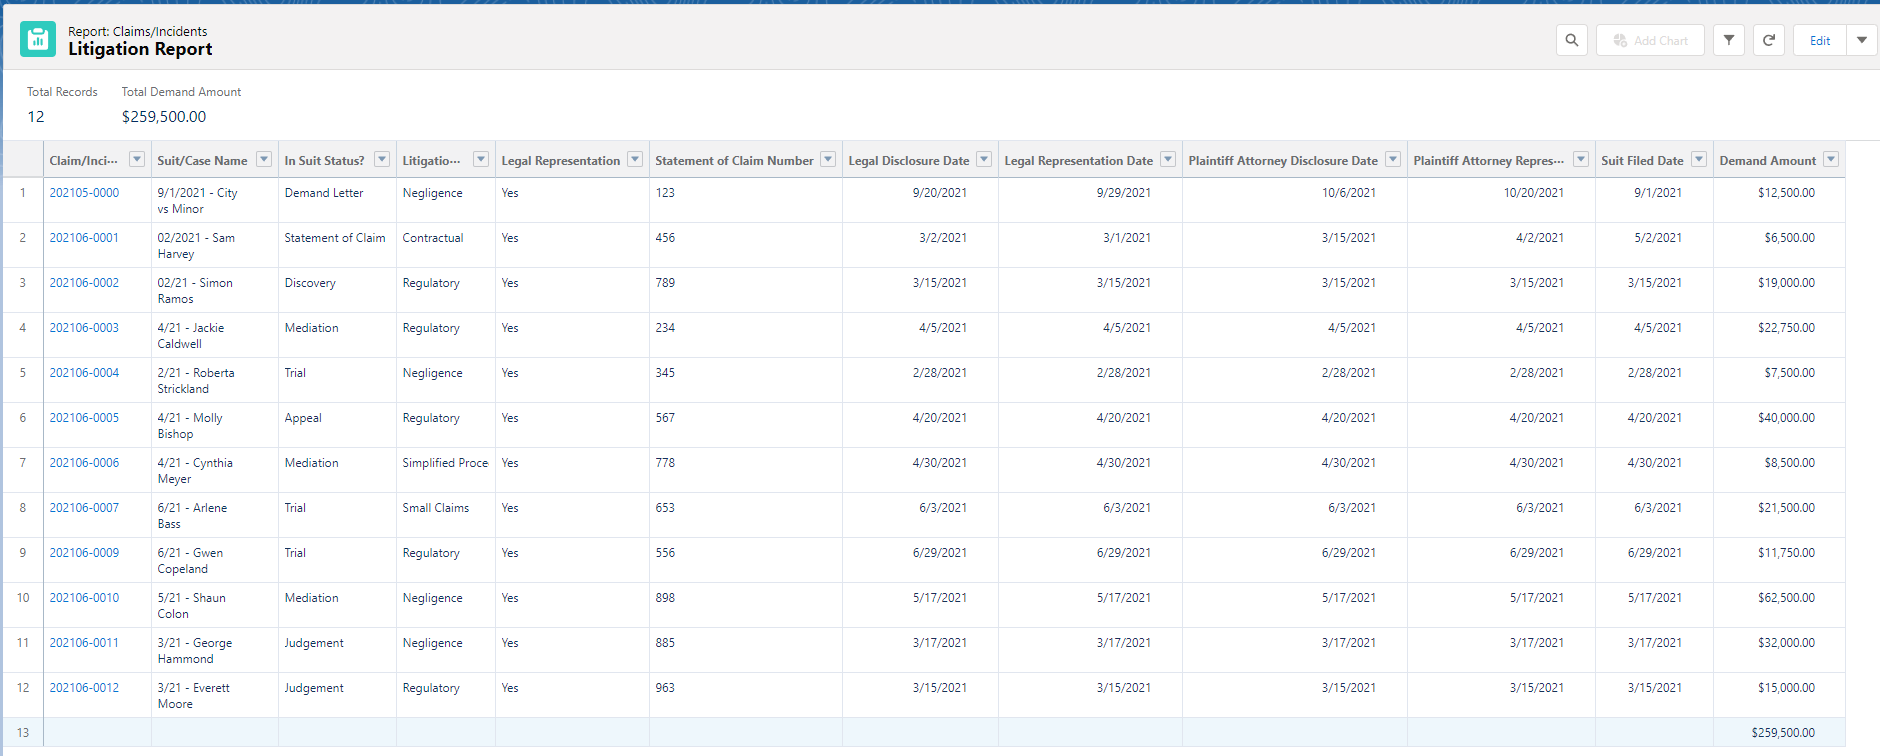
10. Litigation Report
Monitoring this report regularly helps identify key areas where litigation risk is high, allowing the risk team to take action to mitigate its impact in the future. This report shows all claims that have gone to suit and are in a form of litigation. It provides detailed information on where each claim is in the litigation process. This would include suit dates, case numbers, case names, demand amounts, litigation type, Statement of Claim, and any legal representatives involved in the process. Claims that go to suit can often result in large payouts and excessive legal fees, in addition to negatively impacting the company’s reputation. This report helps risk teams know what to prepare for, who is involved in the litigation, and what activities need to be performed.
Conclusion
Reports are an invaluable asset to every risk management team. They are not only critical when reporting to insurers at renewal time, but also for implementing risk management initiatives and corrective action. Moreover, reports contain useful information for the risk management team, management executives, and the department of finance. Insights from reports are meant to inform the end user of what is happening throughout the organization in the form of small, digestible pieces of information. Reports allow risk management teams to confidently inform decision makers with relevant, detailed, and on-time data.
However for reports to be useful, the data collected by risk teams must be complete, organized, and accurate. Truth be told, risk teams are often siloed in the risk management department, with little visibility on what is happening in the rest of the organization. Most data has to be collected manually through a number of spreadsheets and siloed data systems. Furthermore, without a risk management information system (RMIS) to manage and visualize their data, risk teams often have to build reports from scratch. This requires a high level of excel proficiency and a lot of time spent locating and cleaning up data. Alternatively, an RMIS offers a centralized, cloud-enabled infrastructure that streamlines data collection, eliminates siloes, and uses robust analytics to generate real-time reports in seconds. To learn more about how RMIS systems streamline the risk management process, visit our ClearRisk solutions page.


Your comments are welcome.